
Nike (NKE)
James Dunning
Tyler Dunning
Spring 2022
Price as of 2/8/22:
$144
$175-185
21%-28%
Proven track record of sales and profit growth.
World-leading brand provides a durable competitive advantage.
Shift to direct-to-consumer accelerates earnings growth.
Recent price drop creates an attractive entry point.
Allocation: 32 shares (~$4,300)
Company Overview
Key Highlights
- World’s largest seller of sports footwear and apparel. Nike’s global market share stands at an impressive 26%. Founded in 1964, the company has grown to more than $44.5 B in revenue (double that of its closest competitor) and now owns the Jordan, Converse, Hurley, and Cole Haan brands.
- Value Proposition: Quality sportswear that sets the pace on athletic fashion and design and bears the most recognizable status symbol in sports—the Nike brand.
- Manufacturing: Outsources all manufacturing. Nike has contracts with more than 500 factories, primarily located in East Asia (Vietnam, China, Cambodia, and Indonesia).
- Distribution: Sells through both wholesalers and its own operations (Nike Direct), which includes online and 1,000+ retail stores around the world. Nike Direct has in recent years grown to 38% of total sales.
- Demand Creation: Invests well over $3 billion per year in marketing and pro sports contracts, which amounts to ~8.5% of sales.
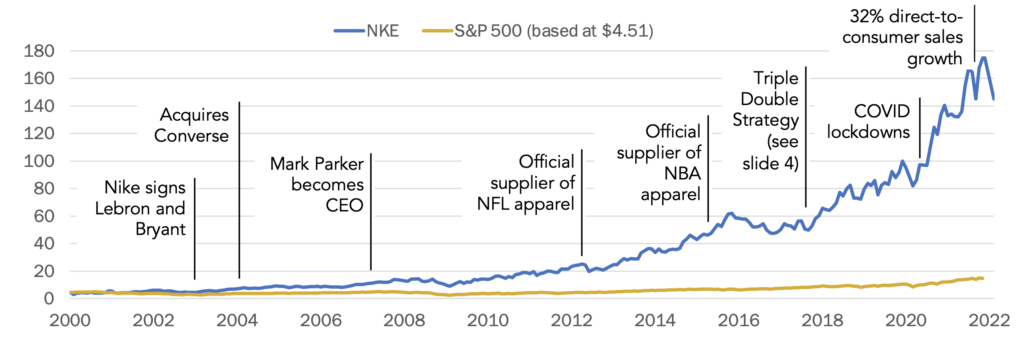
Timeline
Financial Overview
Historical Performance
Revenue and Profit

Summary
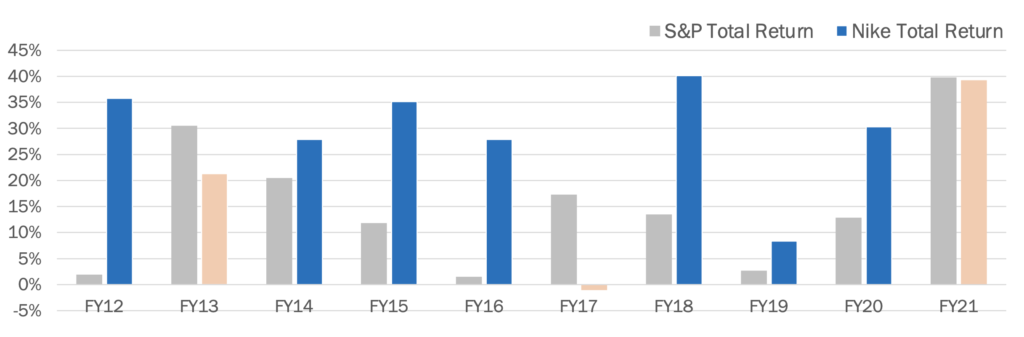
- NKE has outperformed the S&P 500 in total returns 7 of the past 10 years.
- Nike has experienced consistent growth, in both revenue and net margin. 10-year average sales growth of 8%. Average net income growth is at 10%.
- Nike has an ROIC well above its competitors. Averaged more than 22.8% over the past 10 years. This indicates that Nike invests its capital more effectively than competitors like Adidas (15.1%), Under Armour (-0.7%), and Puma (-39%).
Industry Analysis: Summary
Industry Overview
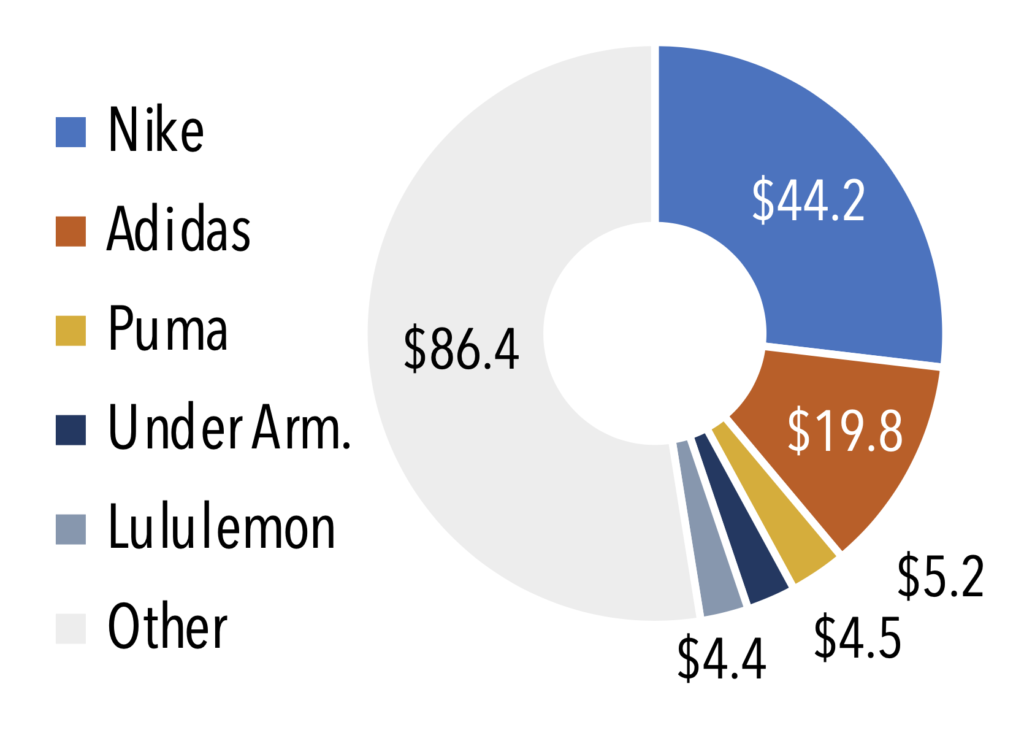
- The sports apparel industry was valued at $160 B in revenue in 2020. The market is dominated by Nike (28%) and Adidas (12%). In the industry, companies are primarily differentiated on brand and quality, not cost.
- Athleisure trend: Casual athletic clothes are increasingly popular. 76% of industry executives believe that athleisure growth will continue.
- Shift to digital sales: pre-pandemic, the average digital sales growth was ~2%. During COVID lockdowns, that rose to 16% growth. Online sales help companies to protect their brand and collect data on consumer behavior.
Market share ($B)
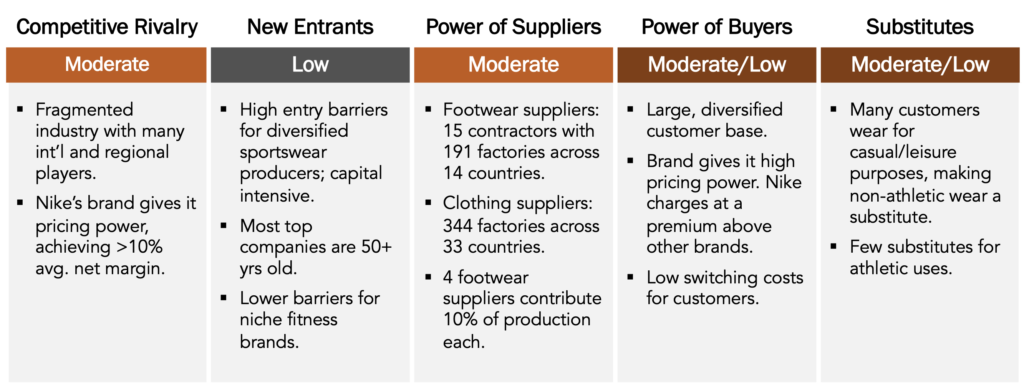
Porter’s Five Forces
Competitive Advantage
Primary/Secondary Business Unit Strategy

Strategic Dimensions & Distinctives (Economic Moat)
“Triple Double” Strategy began in 2017 to achieve 2x growth in 3 areas in 5 years.
- 2x Innovation. Nike’s new, innovative footwear is worn by top athletes around the world. It is “the leader in
sports performance technology” (Morningstar). - 2x Speed to Market. Nike works with suppliers to develop manufacturing tech and aims to reduce lead times from 60 days (in 2017) to 10. Inventory turnover is 14% higher than Adidas’.
- 2x Direct-to-Consumer. Now 38% of sales, DTC affords a 10% wider gross margin and provides insightful data on consumer behavior. Nike aims for DTC to make up 60% of sales by 2040.
Brand. The Nike brand is valued at $30.4 B, more than twice Adidas’. This creates a powerful flywheel—as Nike’s brand generates cash, the company reinvests those funds to bolster its brand.
- More sponsorships. Nike is the #1 sponsor of pro athletes, with a sponsorship market share of 34%. Its current contracts are currently valued at $1.7 B ($300 M more than Adidas). In the NBA, for example, over 70% of players wear Nike shoes; only 17% wear Adidas.
- Superior sponsorships. Nike contracts with many of the best, most talented athletes in the world. Its US athletes won 44 gold medals at the 2016 Summer Olympics. Adidas’ US athletes won only 4. At the Tokyo Olympics, 64% of track athletes who earned medals ran in Nike shoes.
Given that the sports apparel market is highly brand-driven, Nike’s position as the leading sports brand gives the company pricing power over its competitors. Its footwear is, on average, more expensive than Adidas’.
Investment Summary
Investment Thesis
- Nike has a proven track record of revenue and profit growth, a strong average ROIC of 35%, and the dominant market position, by a wide margin.
- Nike’s brand gives it a durable competitive advantage that will allow it to maintain its market share into the foreseeable future. It continues to reinvest in that brand by being more selective about its wholesalers and spending 8% of revenue on demand creation.
- Nike’s shift to direct-to-consumer sales will allow it to expand profit margins and capitalize on consumer data to increase sales, while also protecting brand image from the poor customer experience in 3rd party retail stores.
- Recent drop in price ($145 down from $170) driven primarily by 1) a strong market correction and 2) continued concerns over supply chain issues. These problems should alleviate in the near future, and in the midst of them, Nike has continued to chart significant sales growth in DTC and beat analyst Q2 revenue estimates. The low price provides an attractive entry price.
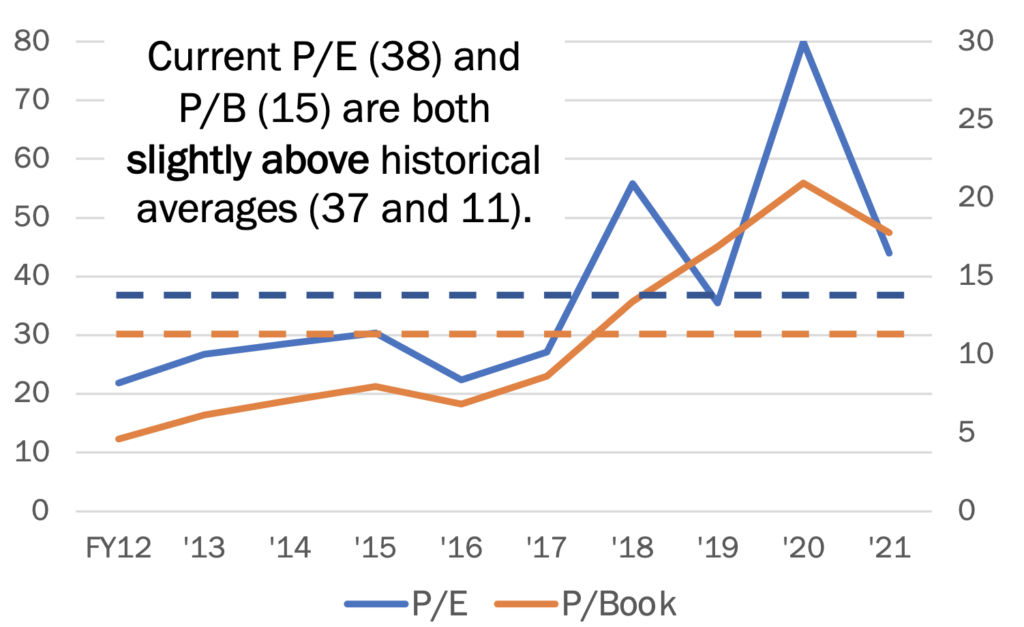
Historical Valuation
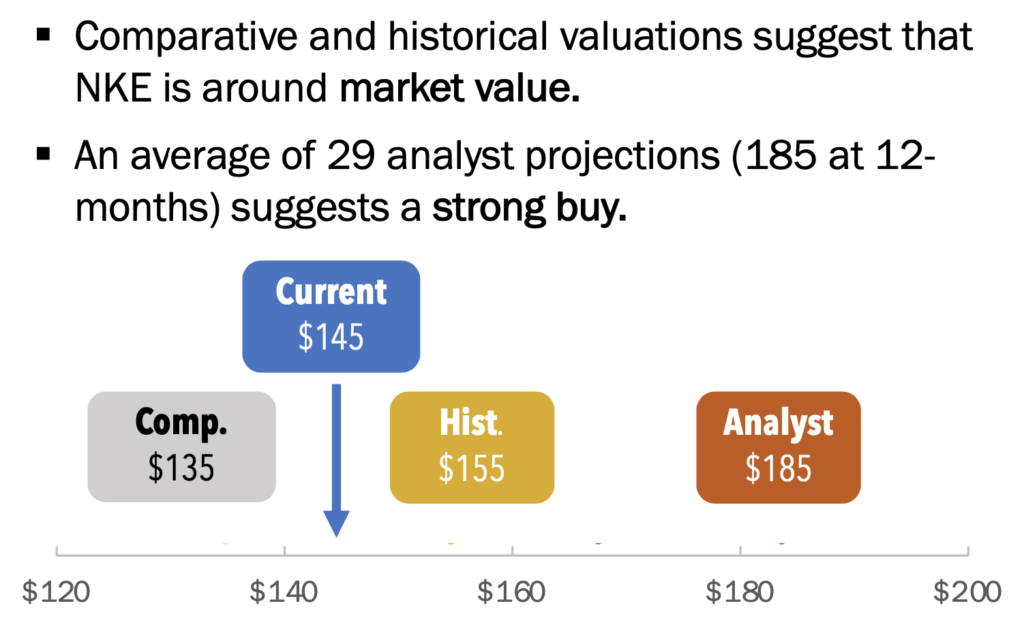
Target Prices
Sources: 10-K, Argus, Morningstar
Appendix: Nike (NKE)
- Valuation: DCF Model and Analyst Estimates
- Headwinds and Tailwinds
- Direct-To-Consumer Strategy
- Decision Day: Recap and Additional Data